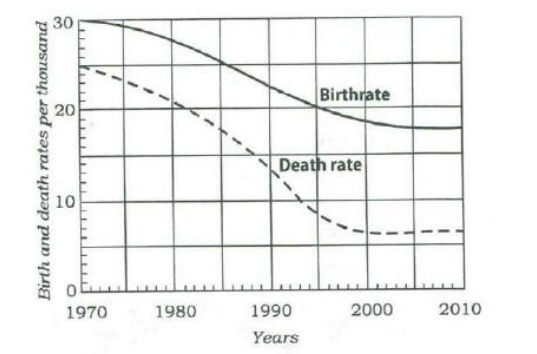
With reference to the above graph, consider the following statements considering 1970 as base year :
1. Population has stabilized after 35 years.
2. Population growth rate has stabilized after 35 years.
3. Death rate has fallen by 10% in the first 10 years.
4. Birthrate has stabilized after 35 years.
Which of the above are the most logical and rational statements that can be made from the above graph?
Correct Option: 2 and 4
- Statement 1 is incorrect: A population only stabilizes (stops growing) when the birthrate equals the death rate (net growth is zero). From the graph, after 35 years (from 1970 to 2005), the birthrate is still higher than the death rate, so the population is still increasing, not stabilized. - Statement 2 is correct: After 35 years (post-2005), both curves run parallel and flat, which means the difference between them (the growth rate) remains constant or stabilized. - Statement 3 is incorrect or not a primary logical statement because a percentage drop in rate does not represent the main trend of stabilization depicted. - Statement 4 is correct: The birthrate curve becomes flat and horizontal after 35 years, indicating that the birthrate itself has stabilized. Thus, statements 2 and 4 are the most logical and rational statements, making Option D the correct answer.
हिंदी में प्रश्न एवं आदर्श उत्तर
ऊपर दिए गए आलेख के संबंध में, 1970 को आधार वर्ष मानकर निम्नलिखित कथनों पर विचार कीजिए :
1. 35 वर्षों के पश्चात जनसंख्या स्थिर हो गई है।
2. 35 वर्षों के पश्चात जनसंख्या वृद्धि-दर स्थिर हो गई है।
3. पहले 10 वर्षों में मृत्युदर में 10% की गिरावट हुई है।
4. 35 वर्षों के बाद जन्मदर स्थिर हो गई है।
उपयुक्त में से कौन-से सवाधिक तार्किक एवं तर्कसंगत कथन हैं जो कि इस आलेख से बनाए जा सकते हैं?
सही उत्तर: 2 और 4
- कथन 1 गलत है: जनसंख्या केवल तब स्थिर (बढ़ना बंद) होती है जब जन्मदर और मृत्युदर बराबर हो जाएं (शुद्ध वृद्धि-दर शून्य हो)। आलेख में, 35 वर्षों के बाद (1970 से 2005 के बाद) भी जन्मदर मृत्युदर से अधिक है, इसलिए जनसंख्या बढ़ रही है, न कि स्थिर हुई है। - कथन 2 सही है: 35 वर्षों के बाद (वर्ष 2005 के बाद), जन्मदर और मृत्युदर दोनों के वक्र समानांतर और क्षैतिज हो जाते हैं, जिसका अर्थ है कि उनके बीच का अंतर (अर्थात् जनसंख्या वृद्धि-दर) स्थिर हो गया है। - कथन 3 मुख्य तार्किक प्रवृत्ति का प्रतिनिधित्व नहीं करता है। - कथन 4 सही है: आलेख के अनुसार, 35 वर्षों के बाद जन्मदर का वक्र पूरी तरह से सपाट और क्षैतिज हो जाता है, जिससे स्पष्ट है कि जन्मदर स्थिर हो गई है। इस प्रकार, केवल कथन 2 और 4 सर्वाधिक तार्किक एवं तर्कसंगत कथन हैं, जो विकल्प D को सही उत्तर बनाते हैं।