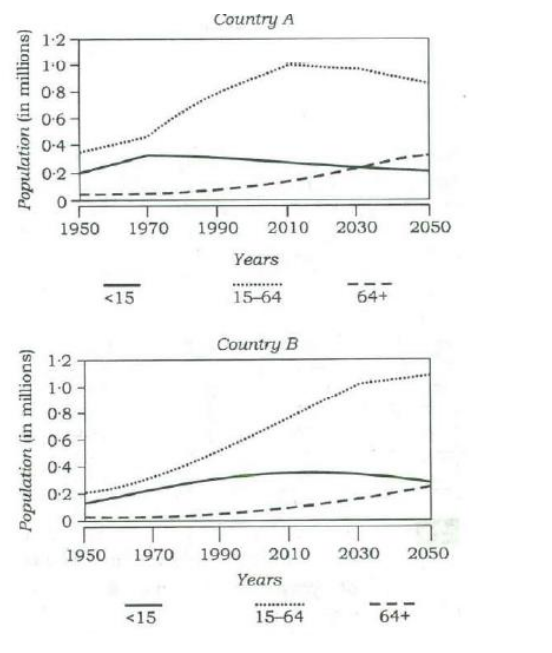
Consider the graphs indicating different age groups in the populations of two countries A and B over a period of few decades. With reference to the graphs, which of the following are the most logical and rational inferences that can be made?
1. Over the last two and a half decades, the dependency ratio for country B has decreased.
2. By the end of next two and a half decades, the dependency ratio of country A will be much less than that of country B.
3. In the next two decades, the workforce relative to its total population will increase in country B as compared to country A.
Select the correct answer using the code given below.
Correct Option: 1 and 3 only
- Statement 1 is correct: The dependency ratio is defined as the ratio of the non-working-age population to the working-age population (15-64 years). For country B, the graph shows that the proportion of the working-age population has steadily increased over the last two and a half decades, which mathematically means the dependency ratio has decreased. - Statement 2 is incorrect: The graphs show that country A's working-age population is declining while the elderly population is rising rapidly, which means its dependency ratio will increase, not become much less than country B's. - Statement 3 is correct: Over the next two decades, country B's working-age group (workforce) is projected to rise or remain high relative to its total population, whereas country A's is declining. Thus, the workforce relative to total population will increase in country B as compared to country A. Consequently, only statements 1 and 3 are valid, making Option C the correct choice.
हिंदी में प्रश्न एवं आदर्श उत्तर
निम्नांकित आलेखों पर विचार कीजिए। आलेखों में दिए गए वक्र कुछ दशकों की अवधि में दो देशों A और B की जनसंख्या में विभिन्न आयु-वर्ग को प्रदर्शित करते हैं। उपर्युक्त आलेखों के संदर्भ में, निम्नलिखित में से कौन-से सवाधिक तार्किक और तर्कसंगत निष्कर्ष (इंफरेंस) निकाले जा सकते हैं?
1. पिछले दई दशकों में देश B के निर्भरता अनुपात में कमी आई है।
2. अगले दई दशकों के अंत में, देश A का निर्भरता अनुपात, देश B के निर्भरता अनुपात की तुलना में बहुत कम हो जाएगा।
3. अगले दो दशकों में, देश A की तुलना में देश B में कुल जनसंख्या के सापेक्ष कार्यशील जनसंख्या बढ़ जाएगी।
नीचे दिए गए कूट का प्रयोग कर सही उत्तर चुनिए।
सही उत्तर: केवल 1 और 3
- कथन 1: निर्भरता अनुपात (Dependency ratio) को कार्यशील आयु वर्ग (15-64 वर्ष) की तुलना में आश्रित जनसंख्या (15 वर्ष से कम और 65 वर्ष से अधिक) के अनुपात के रूप में परिभाषित किया जाता है। देश B के आलेख से स्पष्ट है कि पिछले ढाई दशकों में कार्यशील जनसंख्या के अनुपात में निरंतर वृद्धि हुई है, जिसका अर्थ है कि निर्भरता अनुपात में कमी आई है। अतः कथन 1 सही है। - कथन 2: देश A में कार्यशील जनसंख्या का प्रतिशत गिर रहा है और वृद्धों का प्रतिशत बढ़ रहा है, जिससे इसकी निर्भरता अनुपात बढ़ेगा, न कि देश B की तुलना में कम होगा। अतः कथन 2 गलत है। - कथन 3: अगले दो दशकों में, देश A की तुलना में देश B में कुल जनसंख्या के सापेक्ष कार्यशील जनसंख्या (workforce) का अनुपात अधिक रहेगा और उसमें वृद्धि होगी, क्योंकि देश A का कार्यशील वर्ग तेजी से घट रहा है। अतः कथन 3 सही है। अतः केवल कथन 1 और 3 सही निष्कर्ष हैं, जो विकल्प C को सही उत्तर बनाते हैं।