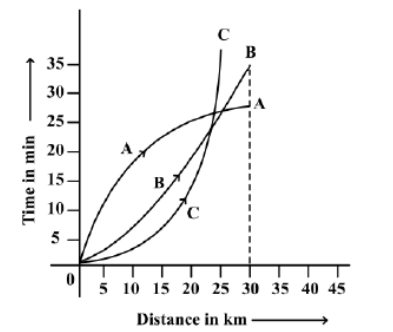
Consider the following distance - time graph. The graph shows three athletes A, Band C running side by side for a 30 km race.
With reference to the above graph consider the following statements:
1. The race was won by A.
2. B was ahead of A up to 25 km 26 mark.
3. C ran very slowly from the beginning. Which of the statements given above is/are correct?
Explanation & Solution
Correct Option: (A) 1 only
हिंदी में प्रश्न एवं आदर्श उत्तर
निम्नलिखित दूरी - समय ग्राफ पर विचार करें। ग्राफ में तीन एथलीट A, B और C को 30 किमी की दौड़ के लिए साथ-साथ दौड़ते हुए दिखाया गया है।
उपरोक्त ग्राफ़ के सन्दर्भ में निम्नलिखित कथनों पर विचार करें:
1. दौड़ A ने जीती।
2. B, 25 किमी 26 मार्क तक A से आगे था।
3. C शुरू से ही बहुत धीरे दौड़ा। उपरोक्त दिए गए कथनों में से कौन सा/कौन से सही हैं?
सही उत्तर: (A) सिर्फ 1