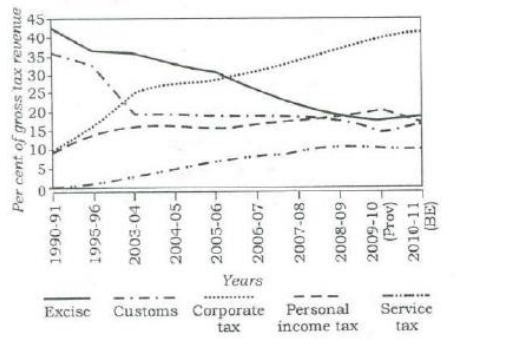
The graph indicates the composition of tax revenue for a period of two decades. With reference to the graph, which of the following is/are the most logical and rational inference/inferences that can be made?
1. During the given period, the revenue from Direct Taxes as percentage of gross tax revenue has increased while that of Indirect Taxes decreased.
2. The trend in the revenue from Excise Duty demonstrates that the growth of manufacturing sector has been negative during the given period.
Select the correct answer using the code given below.
Correct Option: 1 only
Statement 1 is correct because the trend line of Direct Taxes as a percentage of gross tax revenue showed a steady upward trajectory over the two decades, while that of Indirect Taxes showed a corresponding decline. Statement 2 is incorrect because a decline in the share of Excise Duty revenue in gross tax revenue does not imply negative growth of the manufacturing sector. It could be due to rationalization of tax rates, faster growth of other sectors (like services), or shifts in tax structure. Over a period of two decades, India's manufacturing sector grew overall, so assuming negative growth based solely on excise duty percentage is logically flawed. Therefore, only Statement 1 is a logical and rational inference. Thus, Option A is correct.
हिंदी में प्रश्न एवं आदर्श उत्तर
नीचे दिया गया आलेख दो दशकों की अवधि में हमारे कर राजस्व के संयोजन को प्रदर्शित करता है। ऊपर दिए गए आलेख के संबंध में, निम्नलिखित में से कौन-सा/से सार्थिक तर्किक और तर्कसंगत निष्कर्ष (इंफरेंस) निकाला जा सकता है/निकाले जा सकते हैं?
1. दी गई समय अवधि में समग्र कर राजस्व के प्रतिशत के रूप में प्रत्यक्ष करों से राजस्व में वृद्धि हुई है जबकि अप्रत्यक्ष करों से राजस्व में कमी आई है।
2. उत्पाद शुल्क से प्राप्त राजस्व की प्रवृति प्रदर्शित करती है कि दी हुई समय अवधि में निर्माण क्षेत्र का विकास क्रमशःमक रहा है।
नीचे दिए गए कूट का प्रयोग कर सही उत्तर चुनिए।
सही उत्तर: केवल 1
कथन 1 सही है क्योंकि दो दशकों की अवधि के दौरान सकल कर राजस्व के प्रतिशत के रूप में प्रत्यक्ष करों से प्राप्त राजस्व की प्रवृत्ति में निरंतर वृद्धि प्रदर्शित हुई है, जबकि अप्रत्यक्ष करों के हिस्से में तदनुरूपी गिरावट आई है। कथन 2 गलत है क्योंकि सकल कर राजस्व में उत्पाद शुल्क (Excise Duty) के योगदान में कमी का यह अर्थ बिल्कुल नहीं है कि विनिर्माण क्षेत्र का विकास ऋणात्मक रहा है। यह कर दरों में युक्तिसंगत बदलाव या सेवा जैसे अन्य क्षेत्रों के तीव्र विकास के कारण हो सकता है। दो दशकों की अवधि में भारत का विनिर्माण क्षेत्र समग्र रूप से बढ़ा है, इसलिए केवल उत्पाद शुल्क के प्रतिशत पर ऋणात्मक विकास दर मानना तार्किक रूप से त्रुटिपूर्ण है। अतः केवल कथन 1 ही एक तार्किक और तर्कसंगत निष्कर्ष है। इसलिए, विकल्प A सही है।