Home›UPSC Prelims›Paper 2: General Studies II (CSAT)›Civil Services Aptitude Test (CSAT)›Basic Numeracy & Data Interpretation›How much more average profit did A make in the year 2000 than in the
Reading Passage
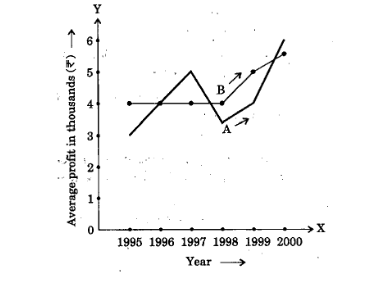
The following graph shows the average profit of two fråit-sellers A and B in thousands (O per year from the year 1995 to 2000. Consider the graph and answer the 4 (four) items that follow

How much more average profit did A make in the year 2000 than in the year 1999?
Question diagram
20142Mprelimsupscyear-2014p2csatquantitative-abilitydata-interpretation
A.Rs 200
B.Rs 1,000Correct
C.Rs 1,500
D.Rs 2,000
Explanation & Solution

Correct Option: (B) Rs 1,000

हिंदी में प्रश्न एवं आदर्श उत्तर

पठित परिच्छेद
The following graph shows the average profit of two fråit-sellers A and B in thousands (O per year from the year 1995 to 2000. Consider the graph and answer the 4 (four) items that follow

How much more average profit did A make in the year 2000 than in the year 1999?

प्रश्न का चित्र
A.Rs 200
B.Rs 1,000सही
C.Rs 1,500
D.Rs 2,000

सही उत्तर: (B) Rs 1,000

See this question in context →
Free Android App

Practice Better on the StatePYQ Mobile App

⚡ Error Diary · ⏱ Timed Mains Answer Pacer · 📴 Offline Revision Vault

Get it onGoogle Play