Home›UPSC Prelims›Paper 2: General Studies II (CSAT)›Civil Services Aptitude Test (CSAT)›Basic Numeracy & Data Interpretation›The proportion of expenditure on various items by two families A and

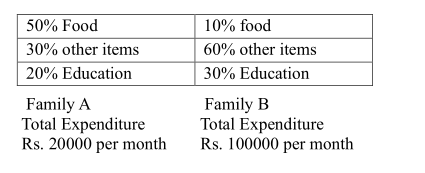
The proportion of expenditure on various items by two families A and B are represented in the following Bar Charts:

From these charts, we can conclude that?
Question diagram
20152Mprelimsupscyear-2015p2csatquantitative-abilitypercentage-and-ratio
A.Family A spent more money on food than Family B.Correct
B.Family B spent more money on food than Family A.
C.Family A and Family B spent the same amount on food.
D.The expenditure on food by Family A and Family B cannot be compared.
Explanation & Solution

Correct Option: (A) Family A spent more money on food than Family B.

Analyze total expenditure allocations to assess food spending.

हिंदी में प्रश्न एवं आदर्श उत्तर

The proportion of expenditure on various items by two families A and B are represented in the following Bar Charts:

From these charts, we can conclude that?

प्रश्न का चित्र
A.Family A spent more money on food than Family B.सही
B.Family B spent more money on food than Family A.
C.Family A and Family B spent the same amount on food.
D.The expenditure on food by Family A and Family B cannot be compared.

सही उत्तर: (A) Family A spent more money on food than Family B.

Analyze total expenditure allocations to assess food spending.

See this question in context →
Free Android App

Practice Better on the StatePYQ Mobile App

⚡ Error Diary · ⏱ Timed Mains Answer Pacer · 📴 Offline Revision Vault

Get it onGoogle Play