Home›UPSC Prelims›Paper 2: General Studies II (CSAT)›Civil Services Aptitude Test (CSAT)›Basic Numeracy & Data Interpretation›What can we say about persons with more than one disease from these
Reading Passage
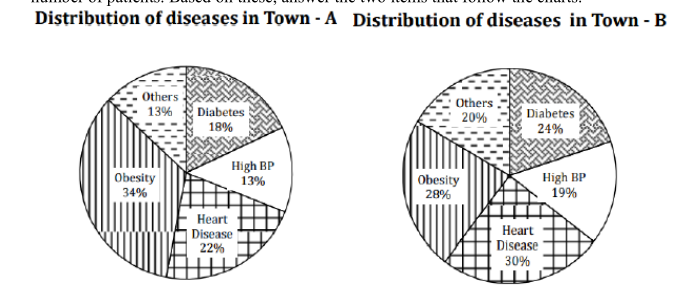
The following pie charts show the break-up of disease categories recorded in the patients from two towns, Town A and Town B. Pie charts plot the disease Categories as percentage of the total number of patients. Based on these, answer the two items that follow the charts.

What can we say about persons with more than one disease from these graphs?
Question diagram
20113Mprelimsupscyear-2011p2quantitative-abilitydata-interpretation
A.There are likely to be persons with more than one disease in Town A.
B.There are likely to be persons with more than one disease in Town B.
C.There are likely to be persons with more than one disease in both Towns A and B.
D.No inference can be drawn.Correct
Explanation & Solution

Correct Option: (D) No inference can be drawn.

हिंदी में प्रश्न एवं आदर्श उत्तर

निम्नलिखित अनुच्छेद पढ़ें और उसके बाद दिए गए प्रश्न का उत्तर दें:

निम्नलिखित पाई चार्ट दो शहरों, शहर A और शहर B, के मरीजों में दर्ज रोग श्रेणियों के विभाजन को दिखाते हैं। पाई चार्ट रोग श्रेणियों को कुल मरीजों की संख्या के प्रतिशत के रूप में प्रदर्शित करते हैं। इनके आधार पर, चार्ट के बाद आने वाले दो प्रश्नों का उत्तर दें।

इन ग्राफ़ों से हम उन व्यक्तियों के बारे में क्या कह सकते हैं जिनके पास एक से अधिक रोग हैं?

प्रश्न का चित्र
A.शहर ए में संभवतः ऐसे व्यक्ति होंगे जिनके एक से अधिक रोग हैं।
B.शहर बी में संभवतः ऐसे व्यक्ति होंगे जिनके एक से अधिक रोग होंगे।
C.संभावना है कि दोनों शहर ए और बी में ऐसे व्यक्ति होंगे जिनमें एक से अधिक रोग हो सकते हैं।
D.कोई निष्कर्ष नहीं निकाला जा सकता।सही

सही उत्तर: (D) कोई निष्कर्ष नहीं निकाला जा सकता।

See this question in context →
Free Android App

Practice Better on the StatePYQ Mobile App

⚡ Error Diary · ⏱ Timed Mains Answer Pacer · 📴 Offline Revision Vault

Get it onGoogle Play