Home›UPSC Prelims›Paper 2: General Studies II (CSAT)›Civil Services Aptitude Test (CSAT)›Basic Numeracy & Data Interpretation›Which region of the curve indicates that the person began showing the
Reading Passage
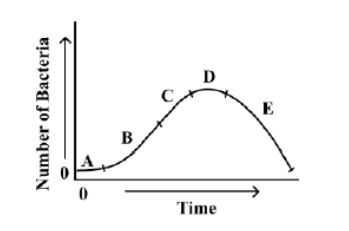
Read the passage given below, study the graph that follows and answer the three items given below the figure.

During a party, a person was exposed to contaminated water. A few days later, he developed fever and loose motions. He suffered for some days before going to a doctor for treatment. On starting the treatment, he soon became better and recovered completely a few days later. The
following graph shows different phases of the person's disease condition as regions A, B, C, D and E of the curve.

Which region of the curve indicates that the person began showing the symptoms of infection?
Question diagram
20113Mprelimsupscyear-2011p2quantitative-abilitydata-interpretation
A.A
B.BCorrect
C.C
D.D
Explanation & Solution

Correct Option: (B) B

हिंदी में प्रश्न एवं आदर्श उत्तर

निम्नलिखित अनुच्छेद पढ़ें और उसके बाद दिए गए प्रश्न का उत्तर दें:

नीचे दिया गया अनुच्छेद पढ़ें, आगे दिए गए ग्राफ़ का अध्ययन करें और चित्र के नीचे दिए गए तीन प्रश्नों का उत्तर दें।

एक पार्टी के दौरान, एक व्यक्ति दूषित पानी के संपर्क में आया। कुछ दिनों बाद, उसे बुखार और दस्त हो गए। वह कुछ दिनों तक पीड़ित रहा, उसके बाद इलाज के लिए डॉक्टर के पास गया। उपचार शुरू करने पर, वह जल्दी ही बेहतर हो गया और कुछ दिनों बाद पूरी तरह से ठीक हो गया। निम्नलिखित ग्राफ़ व्यक्ति की बीमारी की स्थिति के विभिन्न चरणों को कर्व के क्षेत्रों A, B, C, D और E के रूप में दर्शाता है।

कर्व के कौन से क्षेत्र से पता चलता है कि व्यक्ति में संक्रमण के लक्षण दिखाई देना शुरू हुए?

प्रश्न का चित्र
A.A
B.Bसही
C.C
D.D

सही उत्तर: (B) B

See this question in context →
Free Android App

Practice Better on the StatePYQ Mobile App

⚡ Error Diary · ⏱ Timed Mains Answer Pacer · 📴 Offline Revision Vault

Get it onGoogle Play