आलेख को देखकर यह निष्कर्ष निकाला जा सकता है कि वर्ष 1990 से 2010 तक
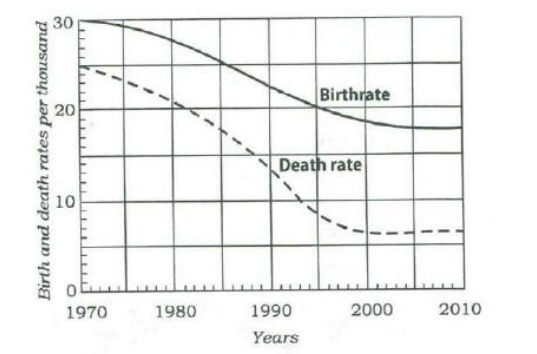
सही उत्तर: जनसंख्या की वृद्धि-दर घटी है
किसी देश की जनसंख्या वृद्धि-दर मुख्य रूप से उसकी जन्मदर और मृत्युदर के बीच के अंतर से निर्धारित होती है (वृद्धि-दर = जन्मदर - मृत्युदर)। वर्ष 1990 से 2010 तक के आलेख (ग्राफ) का ध्यानपूर्वक विश्लेषण करने पर: - जन्मदर के वक्र में लगातार गिरावट की प्रवृत्ति देखी जा सकती है। - मृत्युदर का वक्र या तो अपेक्षाकृत स्थिर है या जन्मदर की तुलना में बहुत धीमी गति से गिर रहा है, जिसके कारण जन्मदर और मृत्युदर के बीच की लंबवत दूरी (अंतर) निरंतर कम होती जा रही है। चूँकि यह अंतर शुद्ध जनसंख्या वृद्धि-दर को दर्शाता है, इसलिए 1990 से 2010 के बीच इस दूरी का कम होना स्पष्ट रूप से यह प्रमाणित करता है कि जनसंख्या की वृद्धि-दर घटी है। अतः विकल्प B सर्वाधिक तार्किक एवं सही निष्कर्ष है। अन्य सभी विकल्प आलेख के आंकड़ों के विपरीत होने के कारण असत्य हैं।
In English (Question & Model Answer)
Looking at the graph showing birthrate and death rate of a country, it can be inferred that from 1990 to 2010
Correct Option: population growth rate has decreased
The population growth rate of a country is primarily determined by the difference between its birthrate and death rate (Growth Rate = Birthrate - Death rate). By carefully observing the trends in the graph from the year 1990 to 2010: - The birthrate curve shows a declining trend. - The death rate curve is either relatively stable or declining at a much slower rate than the birthrate, causing the vertical distance (gap) between the birthrate and death rate curves to continuously shrink. Since this gap represents the net population growth rate, a narrowing gap over the period of 1990 to 2010 indicates that the population growth rate has decreased. Therefore, option B is the correct and logically valid inference. Options A, C, and D are incorrect because they contradict the clear trend of a narrowing gap shown in the graphical data.