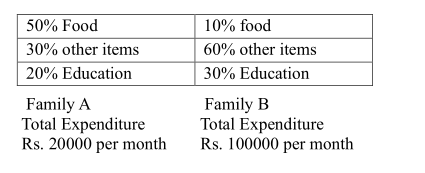
The proportion of expenditure on various items by two families A and B are represented in the following Bar Charts:
From these charts, we can conclude that?
व्याख्या एवं हल
सही उत्तर: (A) Family A spent more money on food than Family B.
Analyze total expenditure allocations to assess food spending.
In English (Question & Model Answer)
The proportion of expenditure on various items by two families A and B are represented in the following Bar Charts:
From these charts, we can conclude that?
Correct Option: (A) Family A spent more money on food than Family B.
Analyze total expenditure allocations to assess food spending.