मुख्य›संघ लोक सेवा आयोग प्रारंभिक परीक्षा›प्रश्न पत्र 2: सामान्य अध्ययन II (CSAT)›सिविल सेवा अभिरुचि परीक्षण (CSAT)›आधारभूत संख्यान एवं आंकड़ों का निर्वचन›What is the difference between the average profit Of B and A in the
पठित परिच्छेद
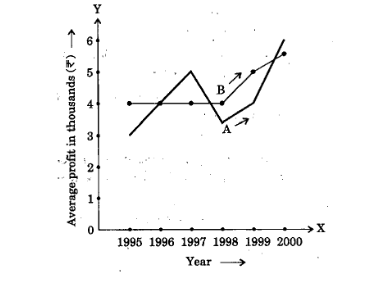
The following graph shows the average profit of two fråit-sellers A and B in thousands (O per year from the year 1995 to 2000. Consider the graph and answer the 4 (four) items that follow

What is the difference between the average profit Of B and A in the year 1998?
प्रश्न का चित्र
20142Mprelimsupscyear-2014p2csatquantitative-abilitydata-interpretation
A.Rs.- 100
B.Rs. - 1,000सही
C.Rs. + 600
D.Rs. - 300
व्याख्या एवं हल

सही उत्तर: (B) Rs. - 1,000

In English (Question & Model Answer)

Reading Passage
The following graph shows the average profit of two fråit-sellers A and B in thousands (O per year from the year 1995 to 2000. Consider the graph and answer the 4 (four) items that follow

What is the difference between the average profit Of B and A in the year 1998?

Question diagram
A.Rs.- 100
B.Rs. - 1,000Correct
C.Rs. + 600
D.Rs. - 300

Correct Option: (B) Rs. - 1,000

इस प्रश्न को संदर्भ में देखें →
निशुल्क एंड्रॉइड ऐप

स्टेट PYQ ऐप पर बेहतर अभ्यास करें

⚡ एरर डायरी · ⏱ मेन्स आंसर पेसर टाइमर · 📴 ऑफलाइन रिवीजन वॉल्ट

डाउनलोड करेंGoogle Play